It is very important to know that in the academic writing task 1, a single pie chart is almost never given without one or two other diagrams accompanying it. Examples include Cambridge IELTS book 8, test 1 (Land degradation) and Cambridge IELTS 4, test 3 (Electricity consumption).
You should note that the description of such a pie chart is not supposed to be very long. Sometimes the introduction and body for the chart are only as long as 50 words or so, like the example below:
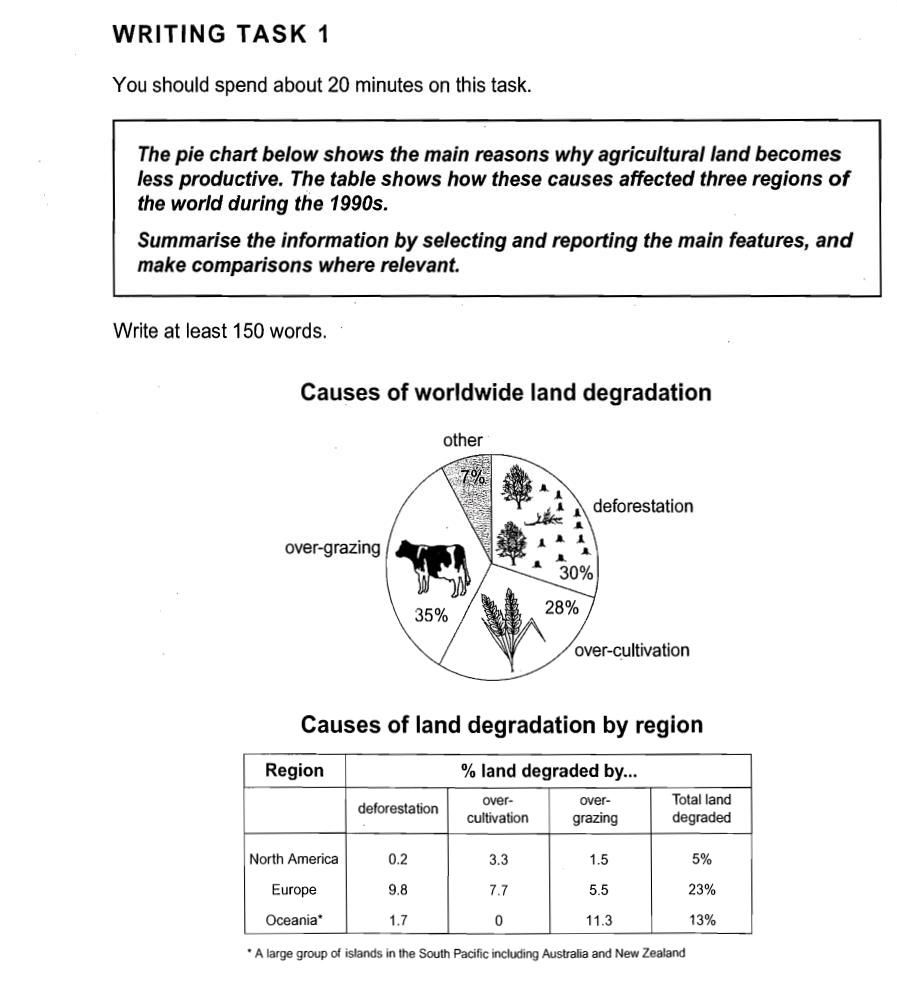
Cambridge IELTS 8, test 1, task 1 Click for larger image
The pie chart compares the shares of various factors in land degradation around the globe. Over-grazing is the most significant cause, accounting for 35%, which was 5% higher than the contribution of deforestation. Over-cultivation was also responsible for 28%, while the remaining 7% results from other causes.
53 WORDS
Note how the introduction and the body of the pie chart description have been written in a single paragraph when there are two diagrams to describe. Many examiners take this approach to paragraphing, writing the introduction and body for each diagram in a separate paragraph and then adding an overview paragraph at the end. Examples of this approach are available in Cambridge IELTS 8 (test 1, task 1) and Cambridge IELTS 6 (test 3, task 1).